NARI Technology (600406.SH): FY2026 Announcement Review & Deep Investment Research
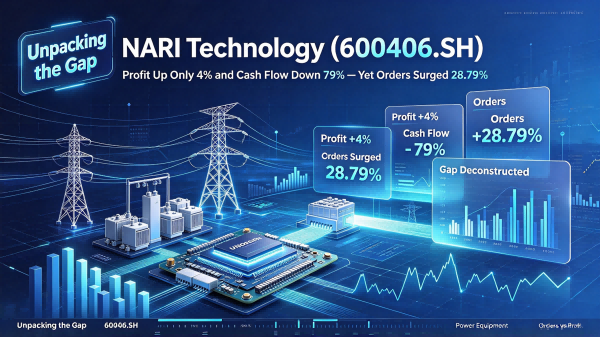
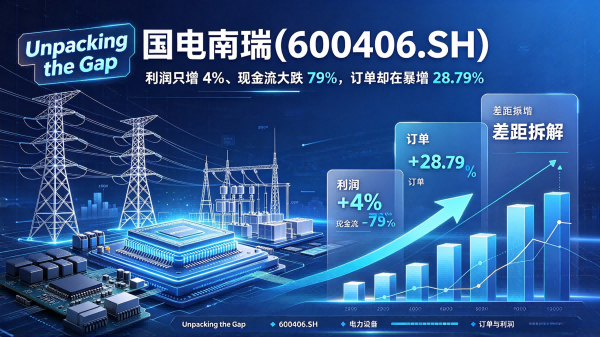
NARI Technology (600406.SH), State Grid's power-grid automation leader, posted 1H2026 revenue +14.54% but profit +4.08% — a revenue-profit gap from low-margin storage, FX losses, and credit impairments, even as new orders +28.79% and overseas revenue +196.61% surged.
The author and the publisher are not registered investment advisers under the U.S. Investment Advisers Act of 1940, nor are they registered as commodity trading advisors. This communication is intended solely for informational purposes and is directed at sophisticated institutional investors and high-net-worth individuals who are capable of independently evaluating investment risks.
As of the publication date, the author(s) and the publisher do not hold a position in the securities discussed herein, including NARI Technology Co., Ltd. (600406.SH), options, or derivatives. No compensation has been received from the issuer, underwriter, or any third party for the preparation or dissemination of this report.
All financial data and projections are based on publicly available company filings (e.g., annual and interim reports, announcements, investor relations materials) and third-party data providers such as Tencent Stock (westock) and public financial media. Figures are presented in RMB (CNY) unless otherwise noted. Cross-market accounting treatments (e.g., PRC GAAP vs. IFRS vs. US GAAP) may result in material restatements.
Forward-looking statements reflect current expectations and involve known and unknown risks; actual results may differ materially. No guarantee is given that any projection will be realized. This report does not provide price targets or trading triggers.
By accessing this content, you agree to our full Terms of Service and Disclaimer. If you are located in the EEA or the United Kingdom, this content is provided on a professional/institutional basis and is not subject to MiFID II unbundling rules.
Executive Summary
In summary, NARI Technology Co., Ltd. (600406.SH), the core listed platform of State Grid and the undisputed leader in power grid automation and relay protection, sustained a trajectory of "full order book + overseas surge + UHV ramp + high dividends and buybacks" in 2026 — delivering 1H2026 revenue of RMB 27.77bn (+14.54% y/y) and net profit attributable to shareholders of RMB 3.07bn (+4.08% y/y), with new orders of RMB 45.63bn (+28.79%), overseas revenue of RMB 5.89bn (+196.61%), and UHV backlog exceeding RMB 8bn, alongside two rounds of buybacks and both annual and interim dividends.
A familiar divergence, however, defines the quality of this growth: net-profit growth (+4.08%) ran far below revenue growth (+14.54%), a "revenue-profit gap" attributable to three forces — low-margin energy-storage scaling, FX losses of RMB 100-200mn, and credit impairments of RMB 80-90mn. This is a power-grid automation core asset with a solid order and growth logic, but with current-period profit temporarily compressed.
Key Charts & Data
| Period | Revenue (RMB bn) | Revenue y/y | Net profit (RMB bn) | Net profit y/y |
|---|---|---|---|---|
| FY2025 | 66.23 | +14.53% | 8.28 | +8.79% |
| 1H2026 | 27.77 | +14.54% | 3.07 | +4.08% |
Segment performance, 1H2026 (revenue / y/y / gross margin):
- Power grid intelligence: RMB 13.31bn / +8.85% / 29.90%
- Energy & low-carbon: RMB 9.61bn / +46.98% / — (storage 15%-20%)
- Digital-energy convergence: RMB 3.70bn / -5.24% / 25.55% (+2.15pct)
- Industrial connectivity: RMB 0.95bn / -23.38% / 24.42% (+4.42pct)
Key leading indicators, 1H2026: new orders RMB 45.63bn (+28.79%); overseas revenue RMB 5.89bn (+196.61%); UHV backlog over RMB 8bn. Valuation: share price RMB 22.52 (30-Sep-2026), market cap ~RMB 181bn, static P/E ~21.5x, P/B ~3.5x. Dividend payout ratio: 60% for three consecutive years.
Detailed Analysis
Announcement Review (FY2026)
The 2026 announcement set clusters around five themes. First, two rounds of buybacks — the first completed on 13-Apr, and the second initiated by the chairman's proposal (20-Jul), launched with a scheme on 14-Aug and the first repurchase on 27-Aug. Second, both annual and interim dividends — the FY2025 10-for-4.75 payout implemented on 23-Jun, and the 1H2026 10-for-1.53 interim payout implemented on 21-Sep, sustaining a 60% payout ratio for three consecutive years. Third, equity-incentive unlocking — the 2021 restricted-stock plan's second tranche unlocked in January and March. Fourth, an accounting-policy change disclosed on 29-Apr. Fifth, recurring related-party transactions with State Grid affiliates, including financial services with China Power Finance.
The most informative signal is the shareholder-return posture: for a State Grid-affiliated central-SOE subsidiary, two rounds of buybacks plus a 60% payout ratio — with interim dividends and buybacks exceeding 40% of 1H net profit — reflect substantive "quality-and-return" delivery. The accounting-policy change warrants verification of its impact on profit comparability.
Investment Analysis
Research question: whether the "revenue-profit gap" reflects a structural trade-off of scaling low-margin storage, or genuine earnings deterioration. Core assumption: grid investment and new power-system construction persist, with high new orders (+28.79%) driving future revenue and overseas (+196.61%) and UHV (backlog over RMB 8bn) opening a second growth curve.
Industry & moat: an upcycle in grid automation, relay protection, UHV/flexible-DC transmission and dispatch, with the company as the undisputed leader under State Grid. The second curve spans overseas, energy storage, IGBT, and solid-state transformers.
Financial five-dimension check: the profit-revenue spread is the key warning — net-profit growth (+4%) at roughly one-third of revenue growth (+14.5%), with blended gross margin down 1.11pct. The safety cushion is robust: new orders +28.79%, UHV backlog over RMB 8bn, a stable power-grid-intelligence margin (29.90%), improving digital-energy and industrial-connectivity margins, and a 16.26% FY2025 weighted ROE.
Governance & capital allocation: State Grid's core listed platform; capital allocation has shifted toward "growth plus shareholder returns" — a 60% payout ratio, two buybacks, R&D at 7.16% of revenue, and overseas/storage expansion, supported by RMB 12.77bn FY2025 operating cash flow.
Valuation: the share price has fallen roughly 28% from its March peak of RMB 31.44 to RMB 22.52, compressing the static P/E to ~21.5x — a relatively low historical percentile. The expectation gap lies in whether the forward indicators (new orders +28.79%, overseas +196.61%, UHV backlog over RMB 8bn) translate into profit once storage margins stabilize and FX and credit impairments fade.
Risks & Disclaimers
Three Under-Appreciated Risks
- A sustained "revenue-profit gap": low-margin storage scaling plus FX losses and credit impairments could keep pressuring earnings quality.
- Operating-cash-flow pressure: 1H2026 operating cash flow fell 78.95% y/y on higher procurement payments, warranting attention to collection cadence and working-capital management.
- Domestic softness and intensifying competition: domestic revenue edged down 1.89%, with growth dependent on overseas (+196.61%) and energy & low-carbon (+46.98%), while storage and power-electronics price competition persists.
Key Risks: A sustained storage price war, FX losses, credit impairments, slower-than-expected order delivery, weaker grid-investment intensity, and raw-material price fluctuations could each materially impact results and share price.
What to Watch
- Storage gross margin and profit-revenue convergence — whether profit growth reconverges with revenue growth.
- Operating cash flow and collection cadence — whether the 1H cash-flow pressure reverses.
- UHV delivery, overseas storage EPC projects, and IGBT verification — whether landmark projects convert to revenue.
Footnotes
Data sources: Financial data from NARI Technology's annual report (FY2025), first-quarter report (2026) and interim report (1H2026); announcement list from Tencent Stock (westock); business developments from official company announcements, earnings-call minutes, and public financial media. All information is compiled from public sources.
B2b — Conflicts of Interest & Holdings. As of the last trading day prior to publication, the author(s) and the publisher do not hold a long or short position in the securities discussed. Neither the author nor the publisher has received any direct or indirect compensation from the issuer, its affiliates, or any underwriter for the production of this report. The publisher does not accept payment for coverage or favorable analysis. If any material conflict arises in the future, it will be prominently disclosed in an updated version of this article.
B2c — Forward-Looking Statements. Certain statements constitute forward-looking statements within the meaning of the U.S. Private Securities Litigation Reform Act of 1995, including but not limited to management guidance, capacity expansion plans, technology adoption timelines, market share projections, and financial targets. Such statements are subject to significant business, economic, regulatory, and competitive uncertainties. Actual outcomes may differ materially. The author and the publisher undertake no obligation to update any forward-looking statement except as required by applicable law.
B2d — Scenario Valuation Boundaries. The scenario analysis (base, bull, bear) presented herein is intended solely as an illustrative framework for understanding key value drivers. It does not represent a price target, fair value estimate, or recommendation to buy, sell, or hold any security. Input assumptions — including revenue growth, margin trajectory, discount rate, terminal value, and foreign exchange rates — are inherently uncertain. Small changes in these inputs can produce large variations in output. Investors should conduct their own independent analysis before making any investment decision.
B2e — Cross-Market & Jurisdictional Notes. This report discusses securities listed on multiple exchanges (e.g., Shanghai Stock Exchange, Hong Kong Stock Exchange, OTC markets). Differences in listing rules, trading hours, settlement cycles, currency (CNY vs. HKD vs. USD), dividend taxation, short-selling regulations, and stock connect mechanisms may materially affect investment outcomes. For EU/UK readers: this content is classified as "non-independent research" and is provided for professional clients / eligible counterparties only; it does not meet MiFID II independence requirements. For US readers: distributed as a general publication under the publisher's investment-adviser registration exemption; not tailored to any individual's financial situation. Always consult a qualified financial advisor before acting on any information herein.